

Landing page quality score is the landing-page component inside Google Ads Quality Score. It measures how relevant, transparent, and easy to navigate your page is for the person who just clicked your ad, and it’s one of three signals that shape your cost per click through Ad Rank. If your account is bleeding CPC, this is usually where the leak starts.
Three fixes move the needle faster than anything else: tightening message match between your ad and your hero copy, fixing mobile Core Web Vitals, and making your call to action and trust signals impossible to miss. Run this triage in the next hour:
- Open your top five keywords by spend and check the “Landing page exp.” column
- Load your top landing page on a phone and time how long it takes to feel usable
- Confirm your H1 repeats the exact promise in your ad headline
- Look for a visible phone number, privacy link, or physical address above the fold
Pro Tip: If you don’t control the website’s code, start with copy and layout changes that a content team can ship this week. Save the Core Web Vitals work for when you have engineering time on the calendar.
Key Takeaways
Landing page quality score improves fastest when message match, mobile Core Web Vitals, and visible trust signals get fixed before any other optimization work.
| Point | Details |
|---|---|
| Three components drive Quality Score | Expected CTR, ad relevance, and landing page experience each report separately as Above, Average, or Below average. |
| Message match is the fastest fix | Rewriting the H1 to mirror the ad’s exact keyword often resolves mismatches within one content sprint. |
| Core Web Vitals targets are specific | Aim for LCP under 2.5 seconds, INP under 200 milliseconds, and CLS under 0.1. |
| Re-evaluation takes 14 to 30 days | Google relies on field data, so judge changes only after that window closes. |
| Golden Path Digital runs the full audit cycle | Its five-step process maps Quality Score components to prioritized fixes and staged verification. |
Table of Contents
- What Is Landing Page Quality Score and How Does It Fit Into Quality Score?
- What Does Google Actually Check on a Landing Page?
- How Do You Check Quality Score Inside Google Ads?
- How Do You Prioritize and Fix Landing Page Problems?
- Which Technical Fixes Move Landing Page Experience the Most?
- How Long Until Google Re-Evaluates Landing Page Changes?
- Which Fixes Match Common ‘Below Average’ Diagnoses?
- How Golden Path Digital Structures a Landing Page Audit
- What I’ve Learned Fixing Landing Pages for Paid Campaigns
- Get Hands-On Help Fixing Landing Page Experience
- Where to Verify Your Landing Page Status
- Sources
- FAQ
What Is Landing Page Quality Score and How Does It Fit Into Quality Score?
Quality Score is a keyword-level diagnostic, scored 1 to 10, built from three components Google evaluates continuously: expected click-through rate, ad relevance, and landing page experience. It exists to answer one question for Google’s ad auction: will this ad and page combination actually satisfy the person searching? The number you see in your account is a summary. The real-time signal that touches your Ad Rank is the underlying component data, refreshed continuously as Google crawls and re-crawls your pages.
The three components break down like this:
- Expected CTR: the likelihood someone clicks your ad when it’s shown for that keyword
- Ad relevance: how closely your ad copy matches the intent behind the search term
- Landing page experience: how relevant, transparent, and navigable your destination page is
Each one shows up in your account as Above average, Average, or Below average, not as its own numeric score. That labeling matters more than the visible 1 to 10 number, because it tells you exactly which lever to pull. Google’s own Quality Score whitepaper describes these statuses as warning lights on a dashboard, not a grade to chase for its own sake.
One detail trips up almost every advertiser new to this: component statuses reflect a rolling comparison window, and Google has indicated it typically needs meaningful field data before it updates a status, which is why a page you fixed last Tuesday won’t show “Above average” by Friday.
What Does Google Actually Check on a Landing Page?
Google evaluates landing pages against a specific set of criteria, and most “Below average” ratings trace back to one of these:
- Relevance and message match: does the page’s headline and content actually deliver on what the ad promised, using the same or closely related keywords
- Transparency and trust: is it obvious what the business is, how to contact it, and how customer data gets used
- Navigation clarity: can someone find what they came for without hunting through menus
- Mobile friendliness: does the page render and function properly on a phone, not just a desktop monitor
- Loading speed and Core Web Vitals: does the page load and become interactive fast enough that people don’t bounce
- Intrusive interstitials: pop-ups or overlays that block content, especially on mobile, actively hurt this score
- Destination requirements: pages need sufficient original content and must comply with Google’s advertising policies to even qualify for a good rating
A concrete example: a lead-gen page that repeats the ad’s exact offer in the first sentence, lists a phone number in the header, and loads in under two seconds will almost always outperform a generic homepage doing double duty as an ad destination, even if the homepage has more content overall.
Google names specific tools for testing these criteria: PageSpeed Insights for load performance, the Mobile-Friendly Test for rendering, and the AMP Validator for accelerated mobile pages. Run your top landing pages through each before you touch any code. The Landing pages report inside Google Ads also surfaces a “Mobile-friendly click rate” column, which is often the fastest way to spot a page quietly failing on phones while performing fine on desktop.

Destination requirements deserve special attention because they’re binary gatekeepers. A page with thin, duplicated, or auto-generated content can get flagged regardless of how fast it loads, so pairing speed fixes with genuinely useful per-page copy solves two problems at once.
How Do You Check Quality Score Inside Google Ads?
Finding your current status takes a few clicks, and finding the history takes a couple more. Here’s the path:
- Go to your Keywords view inside any Search campaign in Google Ads
- Click the columns icon and select “Modify columns”
- Under the Quality Score section, add Quality Score, Landing page exp., Exp. CTR, and Ad relevance
- For trend data, add the historical variants: Quality Score (hist.) and Landing page exp. (hist.), which show what a keyword’s status looked like before recent changes
- Sort by impressions, then scan for “Below average” landing page experience on your highest-volume keywords first
- Segment by device to catch mobile-only problems that desktop performance is masking
This is documented directly in Google’s own Quality Score guidance, and it’s worth bookmarking rather than memorizing. If you’re documenting this audit for a team or client, capture screenshots of the Keywords view with columns visible, plus the Landing pages report, before you make a single change. You’ll want that baseline when you circle back in a month.
How Do You Prioritize and Fix Landing Page Problems?
Not every “Below average” flag deserves the same urgency. Triage by impression volume and conversion impact, not by which fix is easiest.
First hour: Pull your account’s top 10 keywords by spend, check their landing page status, and note which pages serve multiple ad groups. A single page fix here often cascades across dozens of keywords at once.
First week: Run each flagged page through PageSpeed Insights and the Mobile-Friendly Test. Document specific failures rather than general impressions. “LCP is 4.2 seconds on mobile” is actionable. “The page feels slow” is not.
First sprint: Assign fixes by type. Copy and layout issues go to content or design. Core Web Vitals and rendering issues go to engineering. Don’t let a two-line headline fix sit in the same queue as a server migration.
A prioritized fix list based on common symptoms:
- Message mismatch between ad and page: rewrite the H1 and first paragraph to mirror the ad’s exact promise and keyword
- Slow mobile LCP: compress hero images, defer non-critical scripts, and check server response time
- Poor mobile navigation: enlarge tap targets and remove nested menus that require multiple taps
- Missing trust signals: add a visible phone number, privacy policy link, and physical address if applicable
Conversion rate is a useful proxy here, even though Google doesn’t factor it directly into landing page experience calculations. A page with strong technical scores but a weak conversion rate often has a message match or trust problem that automated tools can’t detect.
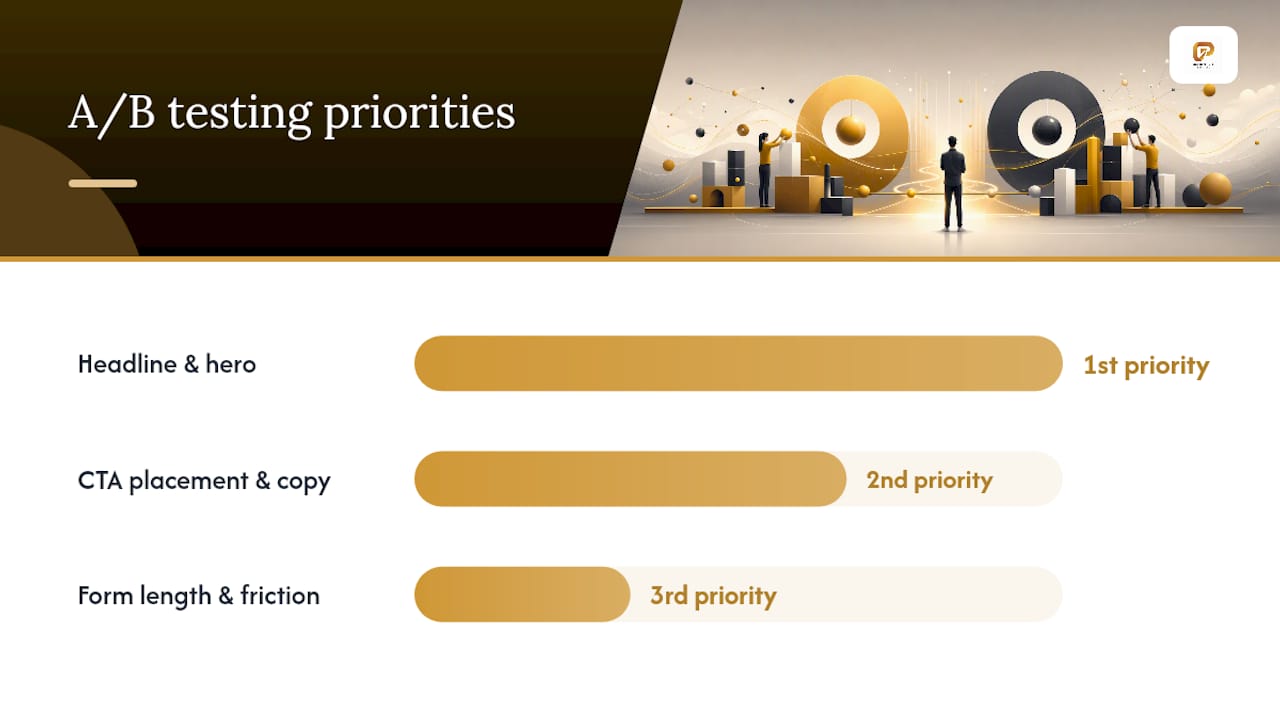
For A/B testing, start with headline and hero message match first, since it’s the cheapest test to run and often the fastest to move the needle. Test hero CTA placement and copy second. Test form length and friction third. Watch the Landing page exp. column, not just conversion rate, since a test can lift conversions while doing nothing for the underlying Quality Score component.
Pro Tip: Run one variable at a time. A test that changes both headline copy and page speed at once tells you something worked, but not which fix actually did the work.
Which Technical Fixes Move Landing Page Experience the Most?
Core Web Vitals sit at the center of most landing page experience failures, and the targets are specific: LCP under 2.5 seconds, INP under 200 milliseconds, and CLS under 0.1. Getting there usually means:
- Serving images in WebP or AVIF format instead of JPEG
- Lazy-loading anything below the fold
- Deferring non-essential JavaScript until after first paint
- Enabling Brotli or Gzip compression on your server
Server and CDN work compounds these gains. Reducing time to first byte, setting proper caching headers, adding edge compression, and using preconnect hints for third-party scripts (fonts, analytics, chat widgets) all shave meaningful time off load speed. A Technical SEO audit covering Core Web Vitals and site performance is often the fastest way to find where the milliseconds are actually going.
Redirect chains are a quiet killer. Every hop between your ad’s destination URL and the final rendered page adds latency and can confuse Google’s crawler about which URL is actually being evaluated. Match your display URL to your final landing page directly, and keep tracking parameters consistent so you’re not accidentally creating duplicate URL variants that split your data.
Pro Tip: Filter out known bot and internal traffic from your analytics before you evaluate field data. A spike in fast load times from your own QA team testing the page can mask a real mobile speed problem your actual customers are experiencing.
How Long Until Google Re-Evaluates Landing Page Changes?
Expect a minimum of 14 days before any change starts showing in component statuses, and closer to 21 to 30 days for a fuller re-evaluation, since Google leans on field data rather than a single crawl. That’s real user traffic hitting your page under normal conditions, not a lab test.
Track these metrics weekly during that window:
- Landing page exp. (current and historical)
- Quality Score average across affected keywords
- Effective CPC
- Click-through rate
- Conversion rate
- Impression share
For attribution, isolate the change. Roll fixes out by ad group or keyword segment rather than site-wide when possible, and hold a comparable segment back as a control. This is the only reliable way to know whether a CPC drop came from your landing page fix or from a seasonal shift in competition. Wait for enough impression volume before trusting any signal. A keyword with 40 impressions a week won’t give you a meaningful before-and-after comparison in under a month.
Which Fixes Match Common ‘Below Average’ Diagnoses?
| Point | Details |
|---|---|
| Message mismatch | Rewrite H1 and first paragraph to mirror the ad’s exact keyword and offer. |
| Slow mobile LCP | Compress hero images, defer scripts, and target under 2.5 seconds. |
| Intrusive interstitials | Remove or delay pop-ups until after the primary content loads. |
| Thin content | Add genuine per-page copy addressing the specific keyword intent, not boilerplate. |
| Missing trust signals | Add visible contact info and a privacy policy link above the fold. |
An e-commerce SKU page that added per-product specifications and a visible return policy moved from thin content flags to a passing Destination Requirements check within one re-evaluation cycle, as explained in this product page SEO optimisation guide for e-commerce. A lead-gen contact page that added a phone number and cut its form from nine fields to four saw conversion rate improve alongside its landing page status. Prioritize fixes on pages responsible for the largest share of your account’s impressions first.
How Golden Path Digital Structures a Landing Page Audit
Golden Path Digital runs paid landing page audits in five steps: discovery of top-spend pages and keywords, diagnostic review of Quality Score components alongside Core Web Vitals, prioritized remediation planning, staged rollout with controlled experiments, and ongoing verification against the metrics above.
- Discovery (2 to 3 days): identify pages carrying the highest ad spend and impression share
- Diagnostic (3 to 5 days): map component statuses against technical performance data
- Prioritized remediation (1 to 2 sprints): assign copy fixes to content, technical fixes to engineering
- Rollout and experiments (1 sprint): stage changes by ad group to isolate impact
- Verification (ongoing): track component status changes over the 14 to 30 day window
Pages serving multiple ad groups get fixed first, since one change there compounds across the account.
What I’ve Learned Fixing Landing Pages for Paid Campaigns
Speed gets all the attention, but it’s rarely the whole problem. A landing page can hit every Core Web Vitals target and still sit at “Below average” because the headline doesn’t match what the ad promised. Message match is usually the fastest win available, and it costs nothing but a content edit.
The biggest mistake I see is treating Quality Score as a vanity metric to report upward instead of a diagnostic to act on. A close second is trusting desktop performance data while ignoring mobile field data, which is where most real users actually land. Smart Bidding will optimize toward whatever CPC baseline your account has already established. It won’t notice or fix a landing page problem sitting upstream of the bid itself.
Get Hands-On Help Fixing Landing Page Experience
Running this audit alongside a full campaign workload is where most in-house teams stall out, especially when the fix list spans copy, engineering, and testing all at once. Golden Path Digital handles the full cycle: audit, prioritized fixes, staged rollout, and measurement against the exact component statuses covered above, so you’re not guessing whether a change actually moved the needle.

The engagement starts with a structured discovery pass identifying which pages and keywords carry the most spend, similar to the framework Golden Path Digital applies in its PPC campaign management work, paired with the technical depth needed to fix Core Web Vitals failures rather than just flag them. If your landing pages are dragging down Quality Score and inflating CPC, start with an assessment to see exactly which components are costing you the most.
Where to Verify Your Landing Page Status
- Google’s Quality Score documentation: the canonical source for component definitions and how to view them in your account
- PageSpeed Insights: confirms whether your Core Web Vitals meet Google’s field data thresholds
- The Mobile-Friendly Test: checks whether a page renders correctly on phones before you spend engineering time elsewhere
- The Landing pages report in Google Ads: surfaces mobile-friendly click rate by URL
Check your Quality Score and Landing page exp. columns before making any changes, and screenshot both the report and the date. You’ll need that baseline to prove what actually moved.
Sources
- About Quality Score for Search campaigns
- Settling the (Quality) Score (Google whitepaper)
- Landing pages (Google Ads Help)
- How to fix: Landing page experience (Quality Score component) — Whitead Wiki
FAQ
What Is a Good Landing Page View Rate?
There’s no single universal benchmark, since it depends heavily on industry and traffic source, but a page consistently rated “Above average” on landing page experience is the practical target rather than chasing a specific percentage.
How Do You Calculate Quality Score?
You don’t calculate it directly. Google generates it from three weighted components, expected CTR, ad relevance, and landing page experience, each reported as Above average, Average, or Below average in your Google Ads account.
What Does Quality Score Mean?
It’s a 1 to 10 diagnostic showing how well your keyword, ad, and landing page combination is expected to perform for searchers, and it functions as a warning system rather than a direct auction input.
How Do You Improve Keyword Quality Score?
Focus on whichever component is flagged “Below average” first. For landing page experience specifically, fix message match, mobile Core Web Vitals, and trust signals, then give Google 14 to 30 days of field data before judging results.
Can Golden Path Digital Help With This?
Golden Path Digital runs structured audits that map Quality Score components to specific technical and copy fixes, then verifies results against the same account-level metrics covered in this guide.