

Digital marketing ROI measures the profit a campaign or channel generates against what it cost, and the most accurate version isn’t the quick revenue-over-spend math most dashboards default to. The formula worth building your reporting around is (LTV × new customers − total marketing cost) ÷ total marketing cost, using gross profit rather than raw revenue. Channel ROAS and 30-day attribution windows will almost always tell a different, rosier story than this number does.
TL;DR:
- Building ROI reports based on gross profit and customer lifetime value provides a more accurate picture than short-term revenue-over-spend calculations, especially for subscription models.
- Properly accounting for fully loaded costs, including salaries and agency fees, can increase reported marketing costs by 40 to 80 percent, significantly impacting ROI calculations.
- Relying solely on short-window ROAS or last-click attribution risks misjudging channel effectiveness, making incrementality testing and fixed attribution windows essential for accurate measurement.
- A healthy LTV to CAC ratio generally falls between 3:1 and 5:1, but this depends on margins and customer churn, requiring context-specific benchmarks.
- Ensuring consistent UTM tagging, CRM integration, and reconciliation of platform data against backend transactions are key to trustworthy ROI measurement.
Table of Contents
- How Do You Calculate Digital Marketing ROI?
- What Metrics Actually Explain Your ROI Number?
- Which Attribution Model Should You Trust?
- What Tracking Setup Do You Need Before You Trust Your ROI Numbers?
- What’s a Good ROI for Digital Marketing?
- How Do You Actually Improve Digital Marketing ROI?
- How Often Should You Report ROI to Leadership?
- What Do You Actually Need to Calculate This Yourself?
- What I’ve Learned Watching Companies Get This Wrong
- When a Managed Partner Beats Building ROI Tracking In-House
- Sources
- FAQ
How Do You Calculate Digital Marketing ROI?
Three formulas get labeled “ROI” in marketing meetings, and they answer different questions. Confusing them is how a campaign that looks profitable in a slide deck turns out to be a loss by year’s end.
Standard ROI is the textbook version: (Revenue − Cost) ÷ Cost × 100. It’s fine for a single campaign with a clear, immediate sale, but it ignores repeat purchases and customer lifetime.
ROAS (Return on Ad Spend) is revenue divided by ad spend, expressed as a ratio like 4:1. It’s the metric ad platforms surface natively, and it’s also the one most likely to mislead you, because it usually counts only first-touch revenue inside a short window.
LTV-based ROI is the one that holds up when finance asks hard questions. It uses gross profit, not revenue, multiplied by expected customer lifetime, then nets out fully loaded marketing costs.
- Calculate LTV: ARPA × gross margin percentage × average customer lifetime in months.
- Multiply LTV by new customers acquired in the period.
- Subtract total, fully loaded marketing cost for that same period.
- Divide by total marketing cost to get your ROI ratio or percentage.
Here’s the gap in practice. A SaaS company funds a campaign and closes 20 customers who each pay a monthly subscription. Year-one revenue ROI looks like a loss once you count onboarding costs. But at 80% gross margin and a 36-month average lifetime, LTV per customer runs well past year-one revenue. Twenty customers times that LTV, minus the campaign spend, produces a genuinely strong return. An ecommerce brand with 30% margins and one-time purchases won’t see anything close to that multiple, and that’s the point: the formula is identical, but the inputs change everything.
Pro Tip: Always build your fully loaded cost figure before you calculate ROI, not after. Include salaries, tool subscriptions, creative production, and agency fees. Auditors routinely find that honest cost accounting raises the reported marketing cost line by 40 to 80 percent once these are added back in.

What Metrics Actually Explain Your ROI Number?
A single ROI figure tells you almost nothing about why it moved. The metrics underneath it are what let you diagnose a problem instead of just reporting one.
- Customer Acquisition Cost (CAC): total fully loaded marketing and sales cost divided by new customers acquired. Blended CAC across all channels is a vanity number; calculate CAC channel by channel or you’ll keep funding your worst-performing source.
- Lifetime Value (LTV): gross profit per customer over their expected relationship with you. For multi-year value, apply a discount rate of 8 to 12 percent when converting future cash flow to present value, since skipping this step can inflate long-term ROI by 15 to 25 percent in typical SaaS models.
- CAC payback period: months of gross margin needed to recover acquisition cost. Shorter is better for cash flow, even when lifetime LTV looks similar.
- LTV:CAC ratio: LTV divided by CAC. A ratio between 3:1 and 5:1 is a commonly cited health range, though it varies with margin and growth stage.
- Conversion rate and average order value (AOV): both move CAC directly. A 20% lift in conversion rate cuts CAC almost as effectively as a 20% cut in ad spend, without touching your bid strategy.
Which Attribution Model Should You Trust?
Last-click attribution is acceptable for short, simple purchase paths, like an impulse buy from a single paid social ad. It becomes actively misleading the moment a buyer touches four or five channels before converting, which is standard for B2B software and considered purchases.
Position-based models, often split 40/20/40 between first touch, middle touches, and last touch, give a more honest view without requiring a data science team. They’re a reasonable middle ground for teams that can’t run full multi-touch attribution.
- Use last-click only for single-session, low-consideration purchases.
- Use position-based or simple multi-touch models for anything with more than one meaningful touchpoint.
- Treat platform-reported conversions (Meta, Google Ads) as directional, not final, since they double-count against each other.
- Reconcile ad platform numbers against CRM-closed revenue monthly, and report the gap, not just one side of it.
Incrementality testing is the closest thing marketing has to a controlled experiment, and it’s the method to lean on before any major budget reallocation. Incrementality tests prove causation rather than correlation, which matters most for high-spend channels where a wrong call is expensive. For B2B companies with long sales cycles, account-level measurement combined with self-reported attribution and periodic incrementality tests tends to produce the most defensible number you can put in front of a board.
What Tracking Setup Do You Need Before You Trust Your ROI Numbers?
No attribution model or formula fixes bad data underneath it. Get the infrastructure right first.
- Standardize UTM parameters across every campaign, with a shared naming convention for source, medium, campaign, and content. A UTM typo is the single most common reason channel-level ROI comes out wrong.
- Connect your CRM to capture lead source, first-touch campaign, deal stage, and close date on every record, not just the ones marketing happens to remember to tag.
- Configure GA4 events around actions that map to revenue (demo requests, trial signups, cart completions), not vanity engagement events.
- Add server-side tracking once meaningful ad spend is at stake. Server-side capture, like Meta’s Conversions API, closes gaps created by ad blockers and browser privacy restrictions, often materially improving conversion fidelity versus browser-only pixels.
- Reconcile weekly. Pull platform-reported conversions against backend transaction counts and investigate any gap larger than 10 to 15 percent.
Pro Tip: If your CRM and ad platform disagree on conversion counts, trust the CRM. Ad platforms are incentivized to attribute generously; your backend transaction log is not. A tool like QuantaPath AI can help keep CRM fields consistent across campaigns without manual data entry.
What’s a Good ROI for Digital Marketing?
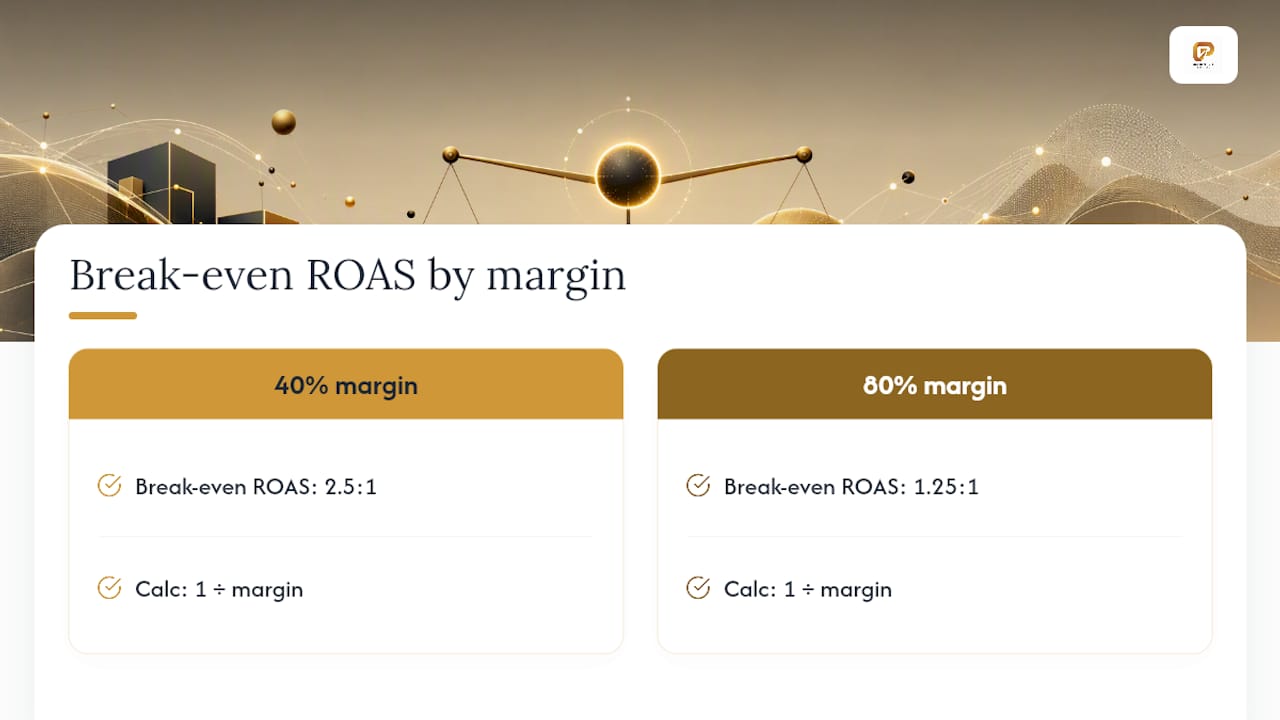
The “5:1 ROAS” figure gets repeated everywhere, but it has no single authoritative origin and doesn’t transfer across business models. A company with 80% gross margin can profitably tolerate a much lower ROAS than one running on 25% margin. Calculate your own break-even ROAS instead: divide 1 by your gross margin percentage. At 40% margin, break-even ROAS is 2.5:1; at 80% margin, it drops to 1.25:1.
Churn changes the math further. A SaaS company losing 5% of customers monthly has a dramatically shorter average lifetime than one losing 1%, which shrinks LTV and tightens what counts as a healthy ratio, even at identical margins.
How Do You Actually Improve Digital Marketing ROI?
Improving ROI comes down to three levers: spend less to acquire, get more value per customer, or both. Prioritize by how fast each move pays back.
- Fix conversion rate before you touch budget. A/B test landing page headlines, form length, and page speed before increasing spend on any channel. This is the fastest lever because it doesn’t require new traffic to see a result.
- Increase LTV through retention, not just acquisition. Onboarding improvements, upsell sequences, and win-back campaigns for lapsed customers raise the numerator of your ROI formula without adding a dollar of spend.
- Test audiences and creative before reallocating budget. Run structured creative and audience tests within a channel before deciding that channel is “underperforming” and moving money elsewhere.
- Use cohort-level analysis, not campaign snapshots. Group customers by acquisition month and track their revenue over time. This is how you catch a channel that looks great at day 30 and mediocre at day 180.
- Run incrementality tests before big reallocations. Holdout groups or geo-based lift tests tell you whether a channel is actually driving incremental revenue or just claiming credit for purchases that would have happened anyway.
Channel mix matters here too. Email marketing consistently reports some of the highest ROI figures of any digital channel, largely because it targets existing relationships rather than paying to reach strangers, which makes it a strong lever for the retention side of this list specifically. SEO and content tend to look weak in a 90-day view and strong in an 18-month view, while paid channels convert faster but sometimes bring higher-churn customers who inflate short-term numbers and deflate long-term ones. A buyer-role mapping approach to SEO content can help align long-cycle content investments with the accounts most likely to convert.
Pro Tip: Before you cut a channel for “poor ROI,” check whether you’re measuring it on a 30-day window when its actual sales cycle is 90 days. This single mistake kills more good channels than any real performance problem does.
How Often Should You Report ROI to Leadership?
Reporting cadence should match how fast a metric actually moves, not how often someone wants a slide.
- Weekly: paid channel spend, cost-per-lead, and pacing against budget, so nothing drifts unnoticed for a month.
- Monthly: channel-level CAC, conversion rate trends, and marketing-sourced pipeline, reviewed against the prior month and the same month last year.
- Quarterly: blended ROI, LTV:CAC ratio, CAC payback period, and any incrementality test results, since these need a longer window to mean anything.
Dashboards built for finance should lead with four tiles: blended ROI, LTV:CAC ratio, CAC payback in months, and marketing-sourced pipeline value. Annotate every figure with its measurement window and attribution model. Separating leading indicators like engagement and qualified accounts from lagging revenue indicators, and fixing the windows you use for each, is what keeps a finance team from asking why last quarter’s “great” campaign never showed up in revenue.
What Do You Actually Need to Calculate This Yourself?
A working ROI model doesn’t require enterprise software. It requires four inputs, tracked consistently: fully loaded marketing cost, new customers acquired, gross margin percentage, and average customer lifetime.
- Template inputs: monthly ad spend, salaries and tool costs, new customers by channel, gross margin, churn rate.
- Template outputs: channel CAC, blended CAC, LTV, LTV:CAC ratio, CAC payback in months, LTV-based ROI.
- Tool categories to connect: CRM (deal and source data), analytics platform like GA4, ad platform dashboards, and an experimentation tool for incrementality and A/B tests.
- Validation checks: confirm UTM parameters are consistent across every live campaign, and confirm platform conversion counts against CRM-closed revenue at least monthly.
| Check | What to verify |
|---|---|
| UTM consistency | Every campaign uses the same source/medium/campaign naming pattern |
| Conversion reconciliation | Platform-reported conversions match CRM records within 10 to 15% |
| Cost completeness | Salaries, tools, and agency fees are included, not just ad spend |
| Window alignment | Reported ROI uses the same attribution window every time it’s compared |
What I’ve Learned Watching Companies Get This Wrong
Most ROI reporting problems aren’t attribution problems. They’re cost-accounting problems dressed up as attribution problems. A company can have a technically correct multi-touch model and still report a fictional ROI because nobody added the account manager’s salary or the agency retainer into the cost side of the equation.
The bigger issue is that teams optimize for the metric that’s easiest to see, which is almost always short-window ROAS, instead of the metric that’s actually true, which requires waiting for cohort data to mature. Once a company starts separating leading indicators from lagging revenue and holding attribution windows fixed, the conversations with finance change entirely. Budget arguments stop being about whose channel “feels” more important and start being about which cohort actually paid back fastest. Golden Path Digital’s own case studies reflect this same pattern: structured measurement work, done before optimization, tends to reallocate budget toward channels that were previously underestimated on short-window numbers alone.
Ty
When a Managed Partner Beats Building ROI Tracking In-House
Using a managed partner is an alternative to hiring and training an internal analytics team from scratch: you get GA4 and CRM integration, managed PPC and SEO execution, and workflow automation solutions, without the six-month ramp-up of building that stack yourself.

Building in-house makes sense when you already have a dedicated analytics hire and a CRM that’s clean. It doesn’t make sense when your team is stretched thin, your UTM tagging is inconsistent, and nobody can confidently answer what last quarter’s marketing spend actually returned. That’s the gap a managed partner can fill: analytics integration, managed PPC and SEO work, and CRM automation solutions, built to feed the exact LTV and CAC payback numbers this article walks through. If your current reporting can’t answer “what’s our LTV:CAC ratio by channel” with confidence, start with an assessment to see where your tracking gaps actually are.
Sources
- Why long sales cycles make B2B marketing hard to measure
- How to Calculate True Marketing ROI for B2B SaaS
- How to Track ROI of Digital Marketing (Without Drowning in Data) | itsdeep
FAQ
What Is a Good ROI for Digital Marketing?
There’s no universal number. A defensible target comes from your own gross margin and CAC payback goals, though an LTV:CAC ratio between 3:1 and 5:1 is a commonly cited health range for many subscription businesses.
Is a 2% ROI Good?
Before concluding a channel is failing at that level, check whether you’re measuring it on too short a window, since content and SEO especially can look poor at 30 days and strong at 12 months.
What Is the 70-20-10 Rule in Digital Marketing?
It’s a budgeting heuristic, not an ROI measurement standard.
What Is the 3-3-3 Rule in Marketing?
Definitions of the 3-3-3 rule vary across marketing disciplines, so treat any specific version with caution unless it’s tied to a documented methodology for your situation.
How Do I Know If My Attribution Model Is Reliable?
Reconcile your ad platform’s reported conversions against your CRM’s closed revenue monthly.